
MCP Server Analytics
MCP Server Analytics Built Into Every Server
Every request, every error, and every dollar of cost is tracked automatically for each MCP server and each tool, with no extra instrumentation to set up.
What's included
Visibility into every MCP server you run
Analytics are part of the platform, not an add-on you configure separately.
Real-time request tracking
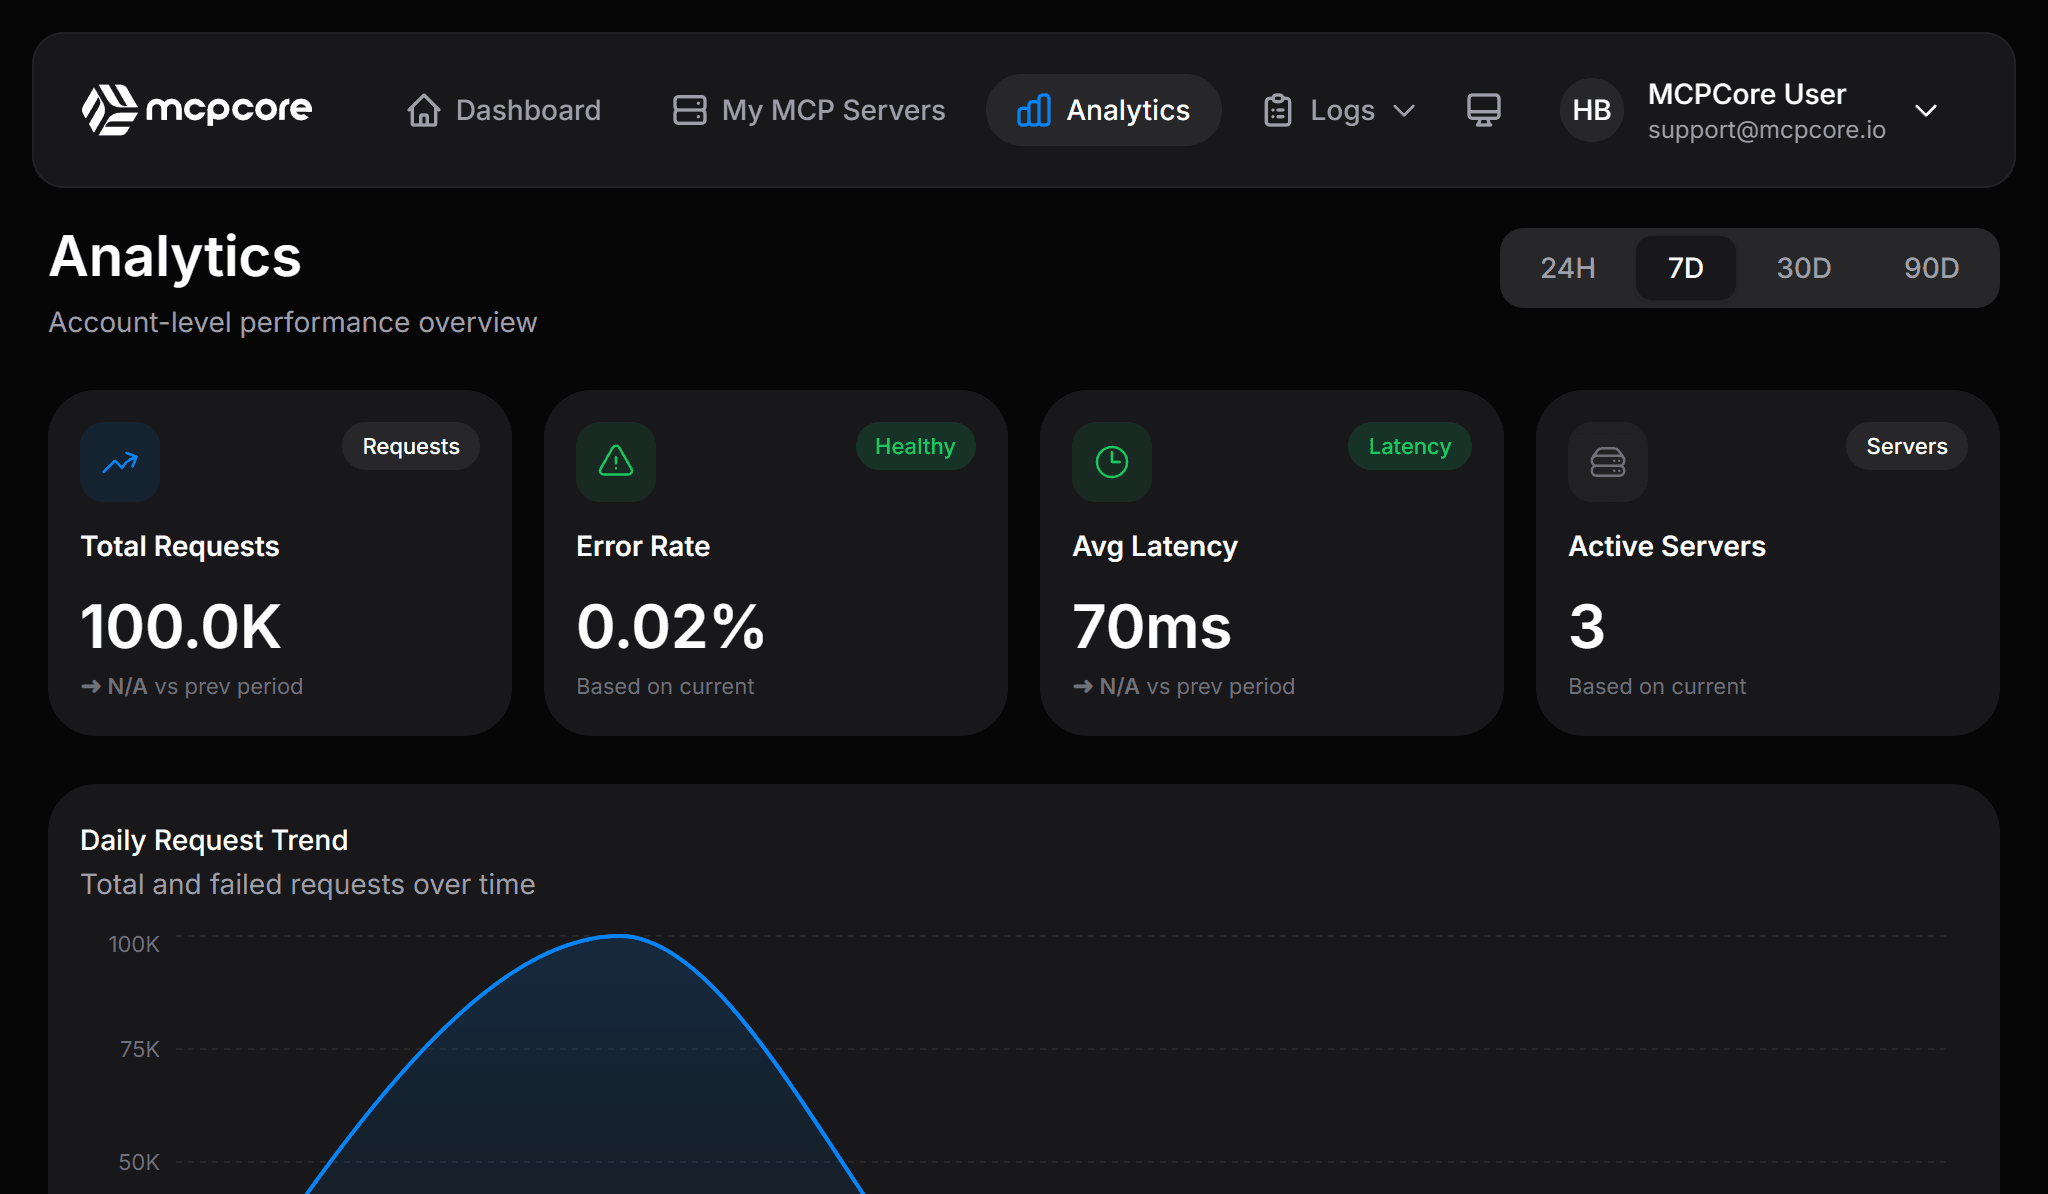
Every call to every tool on your MCP server is logged and reflected in the dashboard as it happens.
Latency per tool
See average and peak response times broken down by individual tool, not just at the server level.
Cost over time
Track cost per server and per tool over time, with daily and hourly breakdowns instead of a single monthly total.
Geographic traffic distribution
Understand where requests to your MCP server are coming from without adding a separate analytics tool.
Error rate and stack traces
Error rate is tracked alongside request volume, and every failure links directly to its full stack trace and input parameters.
No extra instrumentation
Analytics are collected automatically for every tool call. There is no SDK to install or logging code to write.
Dashboard
Every request tracked, every cost measured
Analytics compared
How MCP hosting options handle analytics
Most ways to run an MCP server leave analytics up to you. MCPCore includes it for every server by default.
Analytics included on every plan
Basic analytics are available on the free tier. Paid plans unlock advanced analytics and longer log retention.
FAQ
MCP server analytics questions
Does MCPCore track analytics for every MCP server automatically?
Yes. Analytics are collected for every tool call on every server without any extra configuration or code.
Can I see cost broken down by individual tool?
Yes. The analytics dashboard breaks down requests, latency, and cost by tool, not only by server.
How far back does MCPCore keep analytics history?
Retention depends on your plan, with longer history available on paid tiers. Check the pricing page for exact retention windows per plan.
Do I need to add logging code to my MCP tools to see analytics?
No. Every tool call is tracked automatically, including failed calls and their full stack trace.
Start building today
Free tier available. No credit card required. Get your first MCP server running in minutes.